Forecast Feature
What is Forecast?
It’s the ability to predict future values or trends by analysing historical data. In the particular case of time series, this is done by considering time an independent variable and examining the dependent variable, which is the desired target.
Good forecasting is obtained by determining a model that describes the pattern of the time series, taking into consideration the variable of interest, and not the factors that influence it. Based on the resulting information, it is possible to make a prediction, a statement of a future event, or generating other useful insights.
At a certain point, the data used to predict the variable of interest could be itself forecasted. However, even at the simplest forecasting methods, it is typical to observe a certain level of risk and uncertainty. It is thus essential that the provided information is up to date so that forecasts are as accurate as possible.
Why use it?
Whatever the circumstances or time horizons involved, forecasting is a powerful aid to effective and efficient planning. Forecasting should be an integral part of the decision-making activities of management, as it can play a significant role in many sectors of a company.
However, classical time series predictions are difficult and usually require specialised staff like data scientists to implement it. It requires effort from users to obtain the best possible predictions.
That task becomes monotonous as the amount of data increases, ultimately coming across as a costly activity to maintain a complex forecasting platform or other services.
That is where Statful comes in. Developers and business operators can access an intuitive UI to generate meaningful predictions for a variety of scenarios in the business context.
Facebook’s Prophet (Why are we using FB Prophet?)
At this initial stage, Statful’s Forecasting makes use of Facebook’s Prophet.
Facebook developed an open sourcing forecast tool built with Stan, available in both Python and R.
By using time as a regressor, Prophet tries to fit several linear and nonlinear functions of time as components of the model. Modelling seasonality is approached as an additive component, much like the exponential smoothing in the Holt-Winters technique. It frames the forecasting problem as a curve-fitting exercise rather than looking explicitly at the time-based dependence of each observation within a time series.
So, Prophet has been built to address predictive analytics issues and provides a practical approach to forecasting at scale. It intends to automate the characteristic features of business time series by providing tunable and categorical methods. As it allows for a much more straightforward experience to create a reasonable and accurate forecast, it made sense for us to use it on this initial phase.
For additional information on Prophet, please check their official online documentation.
What is happening?
Behind the scenes, Statful looks at the metrics data and runs it through the model, to provide a forecast.
The produced forecasting shows a result with a confidence level of 80%, which does not take into consideration seasonality events and other observation noises. It does, nonetheless, help you get the first insight to your metric trend, maybe even answering your most lingering doubts.
With that in mind, it is very straightforward to generate a forecast on Statful:
- First off, select a metric that has a sufficient history of data. The minimum advised is three months past.
If at any point you choose a metric with insufficient data, a warning sign is visible. Please consider that a minimum of information is required to extrapolate a trend.
When applicable, choose any aggregations, transformation, and tags. Although it is an optional choice, the default transformation or aggregation is applied.
Afterwards, define how much into the future you want to see.
An example of a page load from the last nine months and its generated three-month forecasting result is demonstrated below:
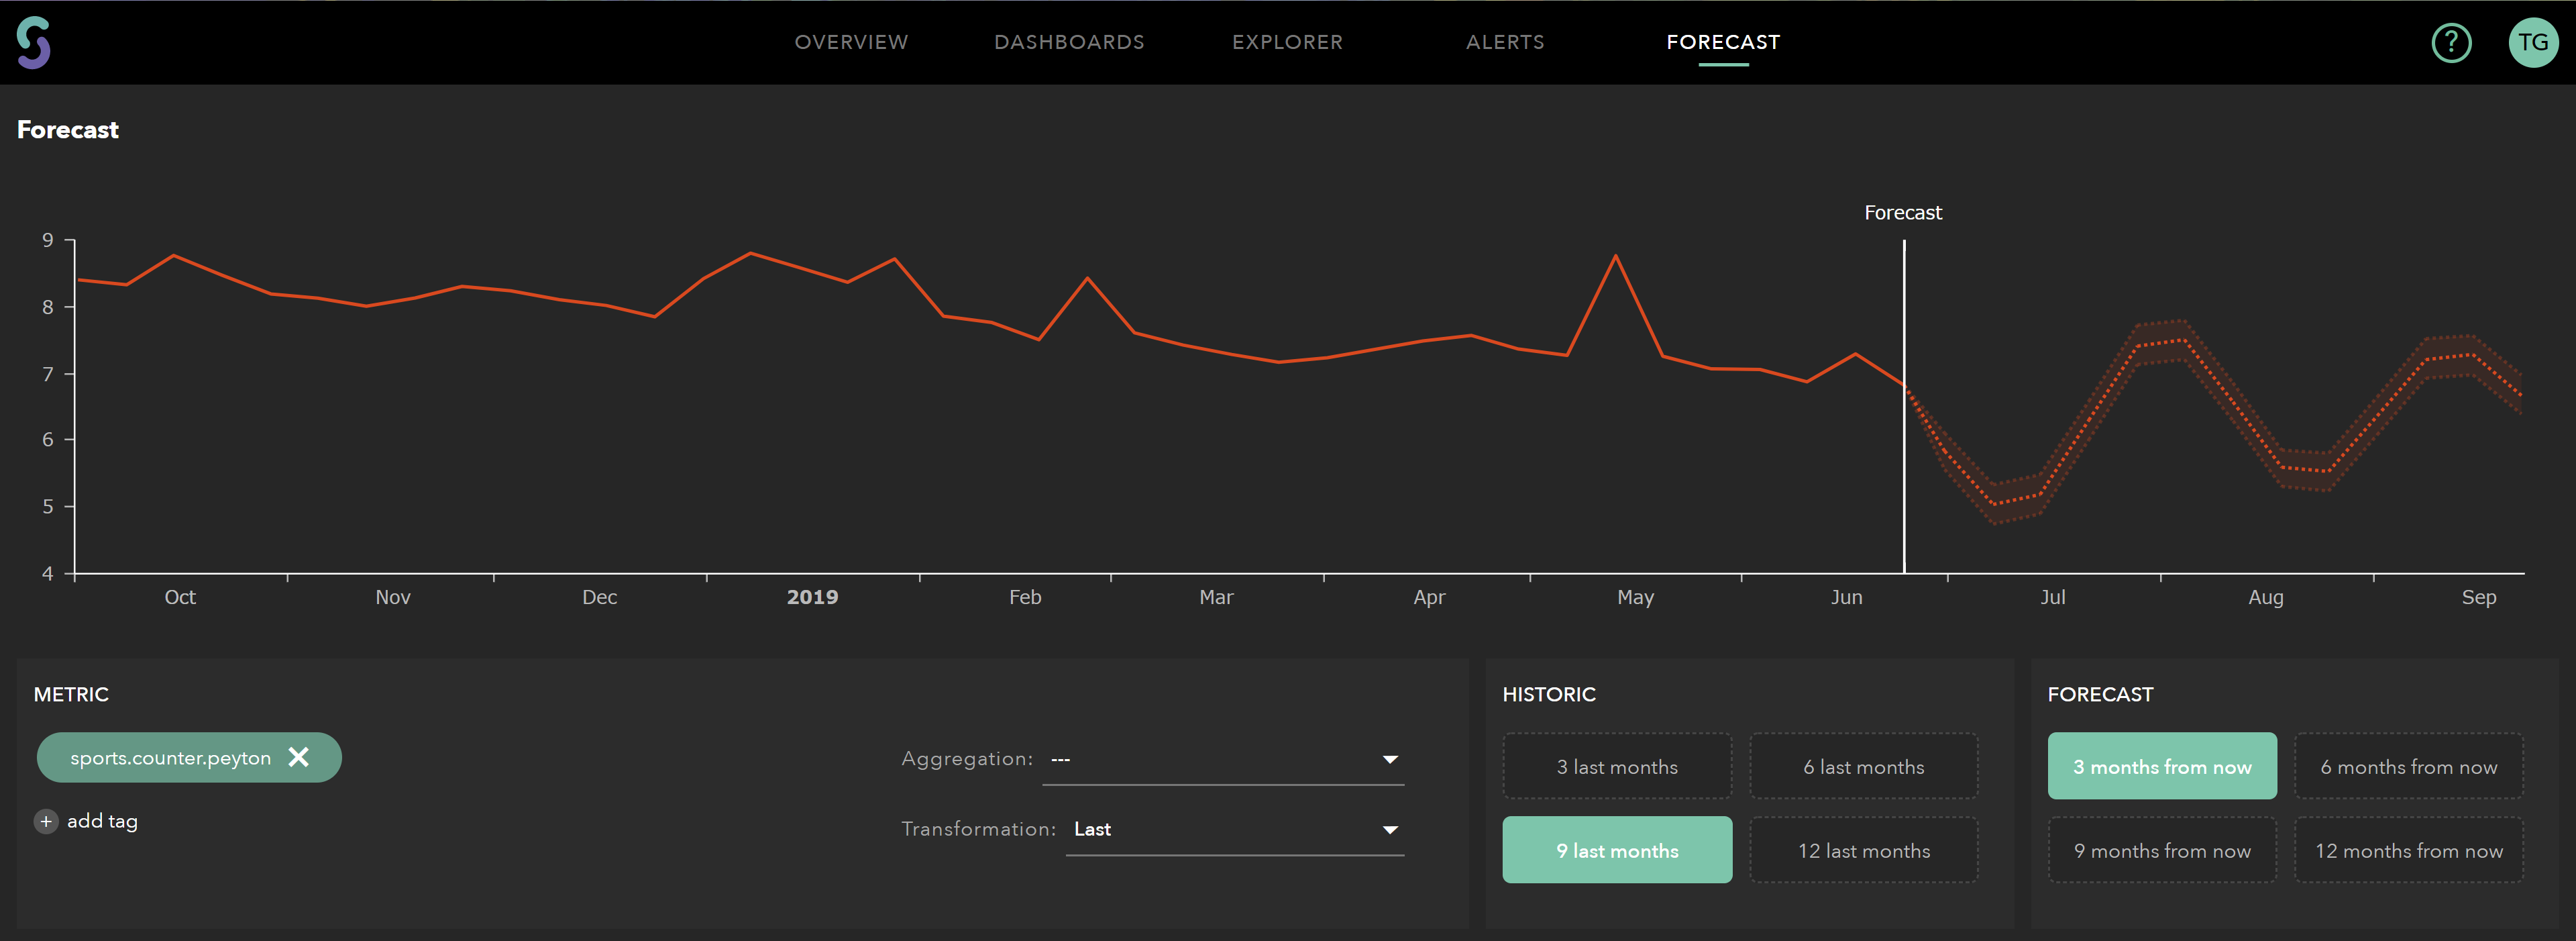
The plot reflects the value (in this case, the last value) of the forecast in deep red. The light red shade portraits the uncertainty intervals for the trend component.
What’s next?
Like we’ve mentioned before, this is an early stage of what we want to release as a Forecast Engine.
Furthermore, at the moment, the forecasts are only visualised within the application. On the next phase of the product, it will also be possible to export them in an image or other formats.