Starter Kits
Statful Starter Kits are tools that act as accelerators to help Users set up their Statful environment based on our clients’ and collectors’ configurations. Starter Kits provide one or more predefined configurations, which the Users can choose from and quickly set up their monitoring environment without much manual effort.
Before you get started
Before you launch any of the Starter Kits, your account must be configured with (at least) one Access Token and, possibly, whitelist a Domain.
You can find more information about authentication settings here.
We suggest you go through the process of creating the Dashboards/Widgets first and set up the configurations on your project later, with the help of our documentation on GitHub.
A Dashboard organises, stores and communicates metrics visually in the form of Widgets.
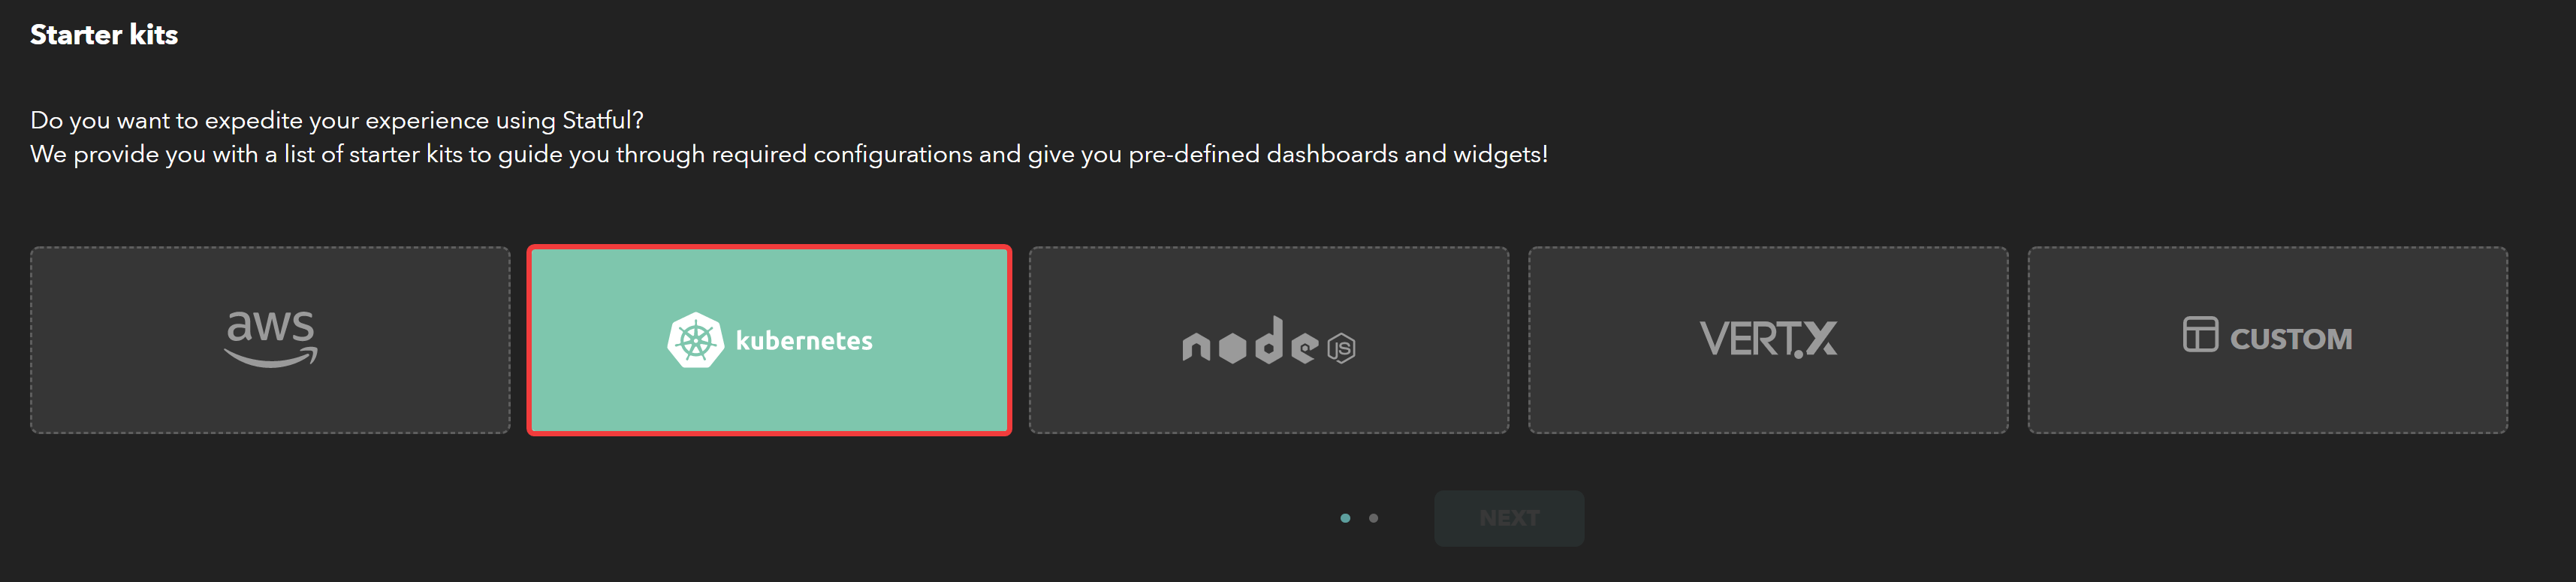
At the moment, Statful provides Users with the below Starter Kits:
- AWS collector
- Kubernetes collector
- NodeJS client
- Vert.x client
- Custom option
Each Starter Kit has predefined Dashboards and Widgets that are customisable. The goal is to help you establish a good monitoring base.
From there, it becomes easier to manipulate data. You can exploit your visualisation, referring to this section on our Dashboards menu, and manipulate data with the help of this reference on the Explorer menu.
How it works
With a collector or a client in mind, go ahead and select it from the available.
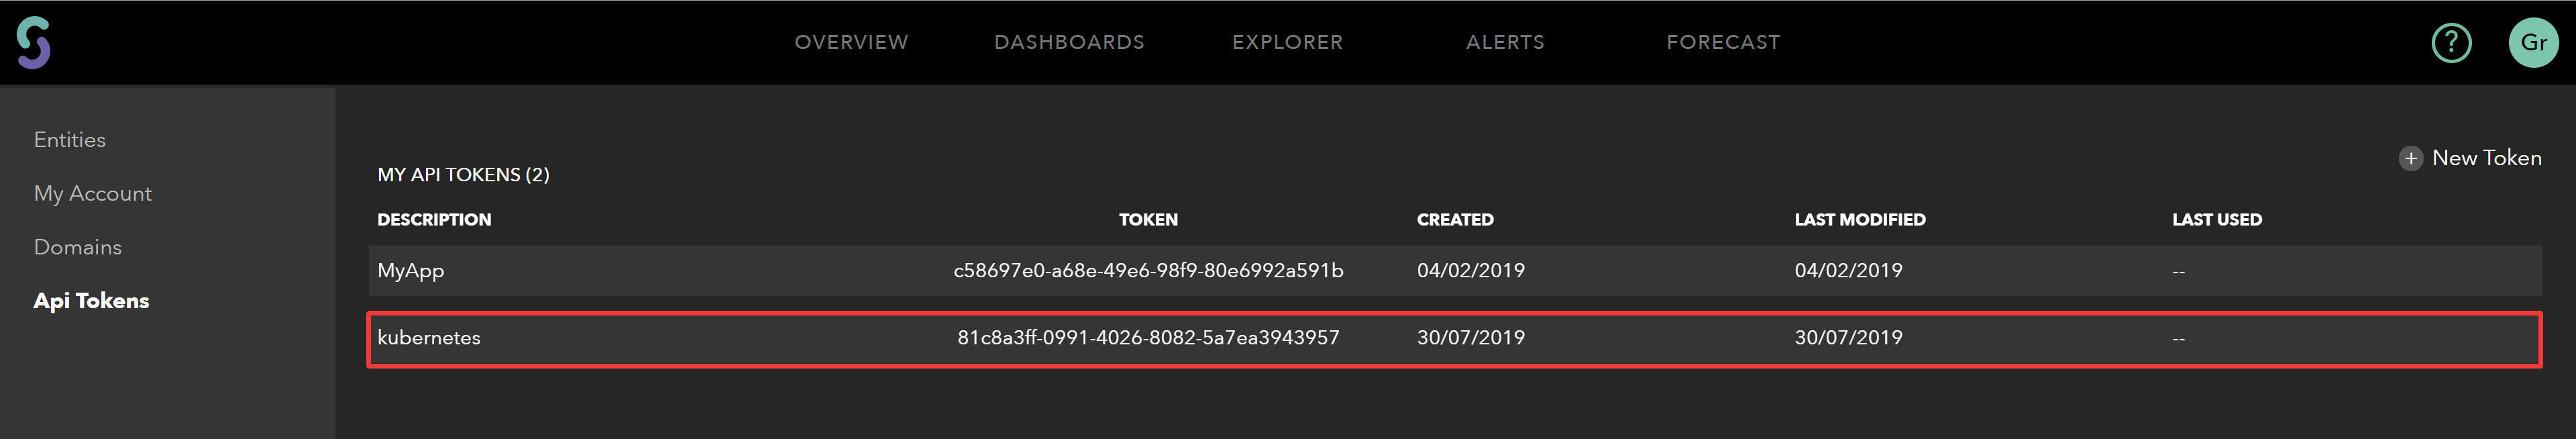
It is also possible to generate an Authorisation Token from the service’s Starter Kit. Click on the option GENERATE TOKEN (OPT).
The resulting Token can be found in Settings >> API Tokens under the name of the corresponding Starter Kit.
For example, generating a Token under the Kubernetes collector produces an entry kubernetes on the API Tokens’ table.
Let’s head back to the Overview. The next option for your selection is the Blank and Pre-configuration. Clicking on the later opens a window with the available options distributed over Dashboards and Widgets.
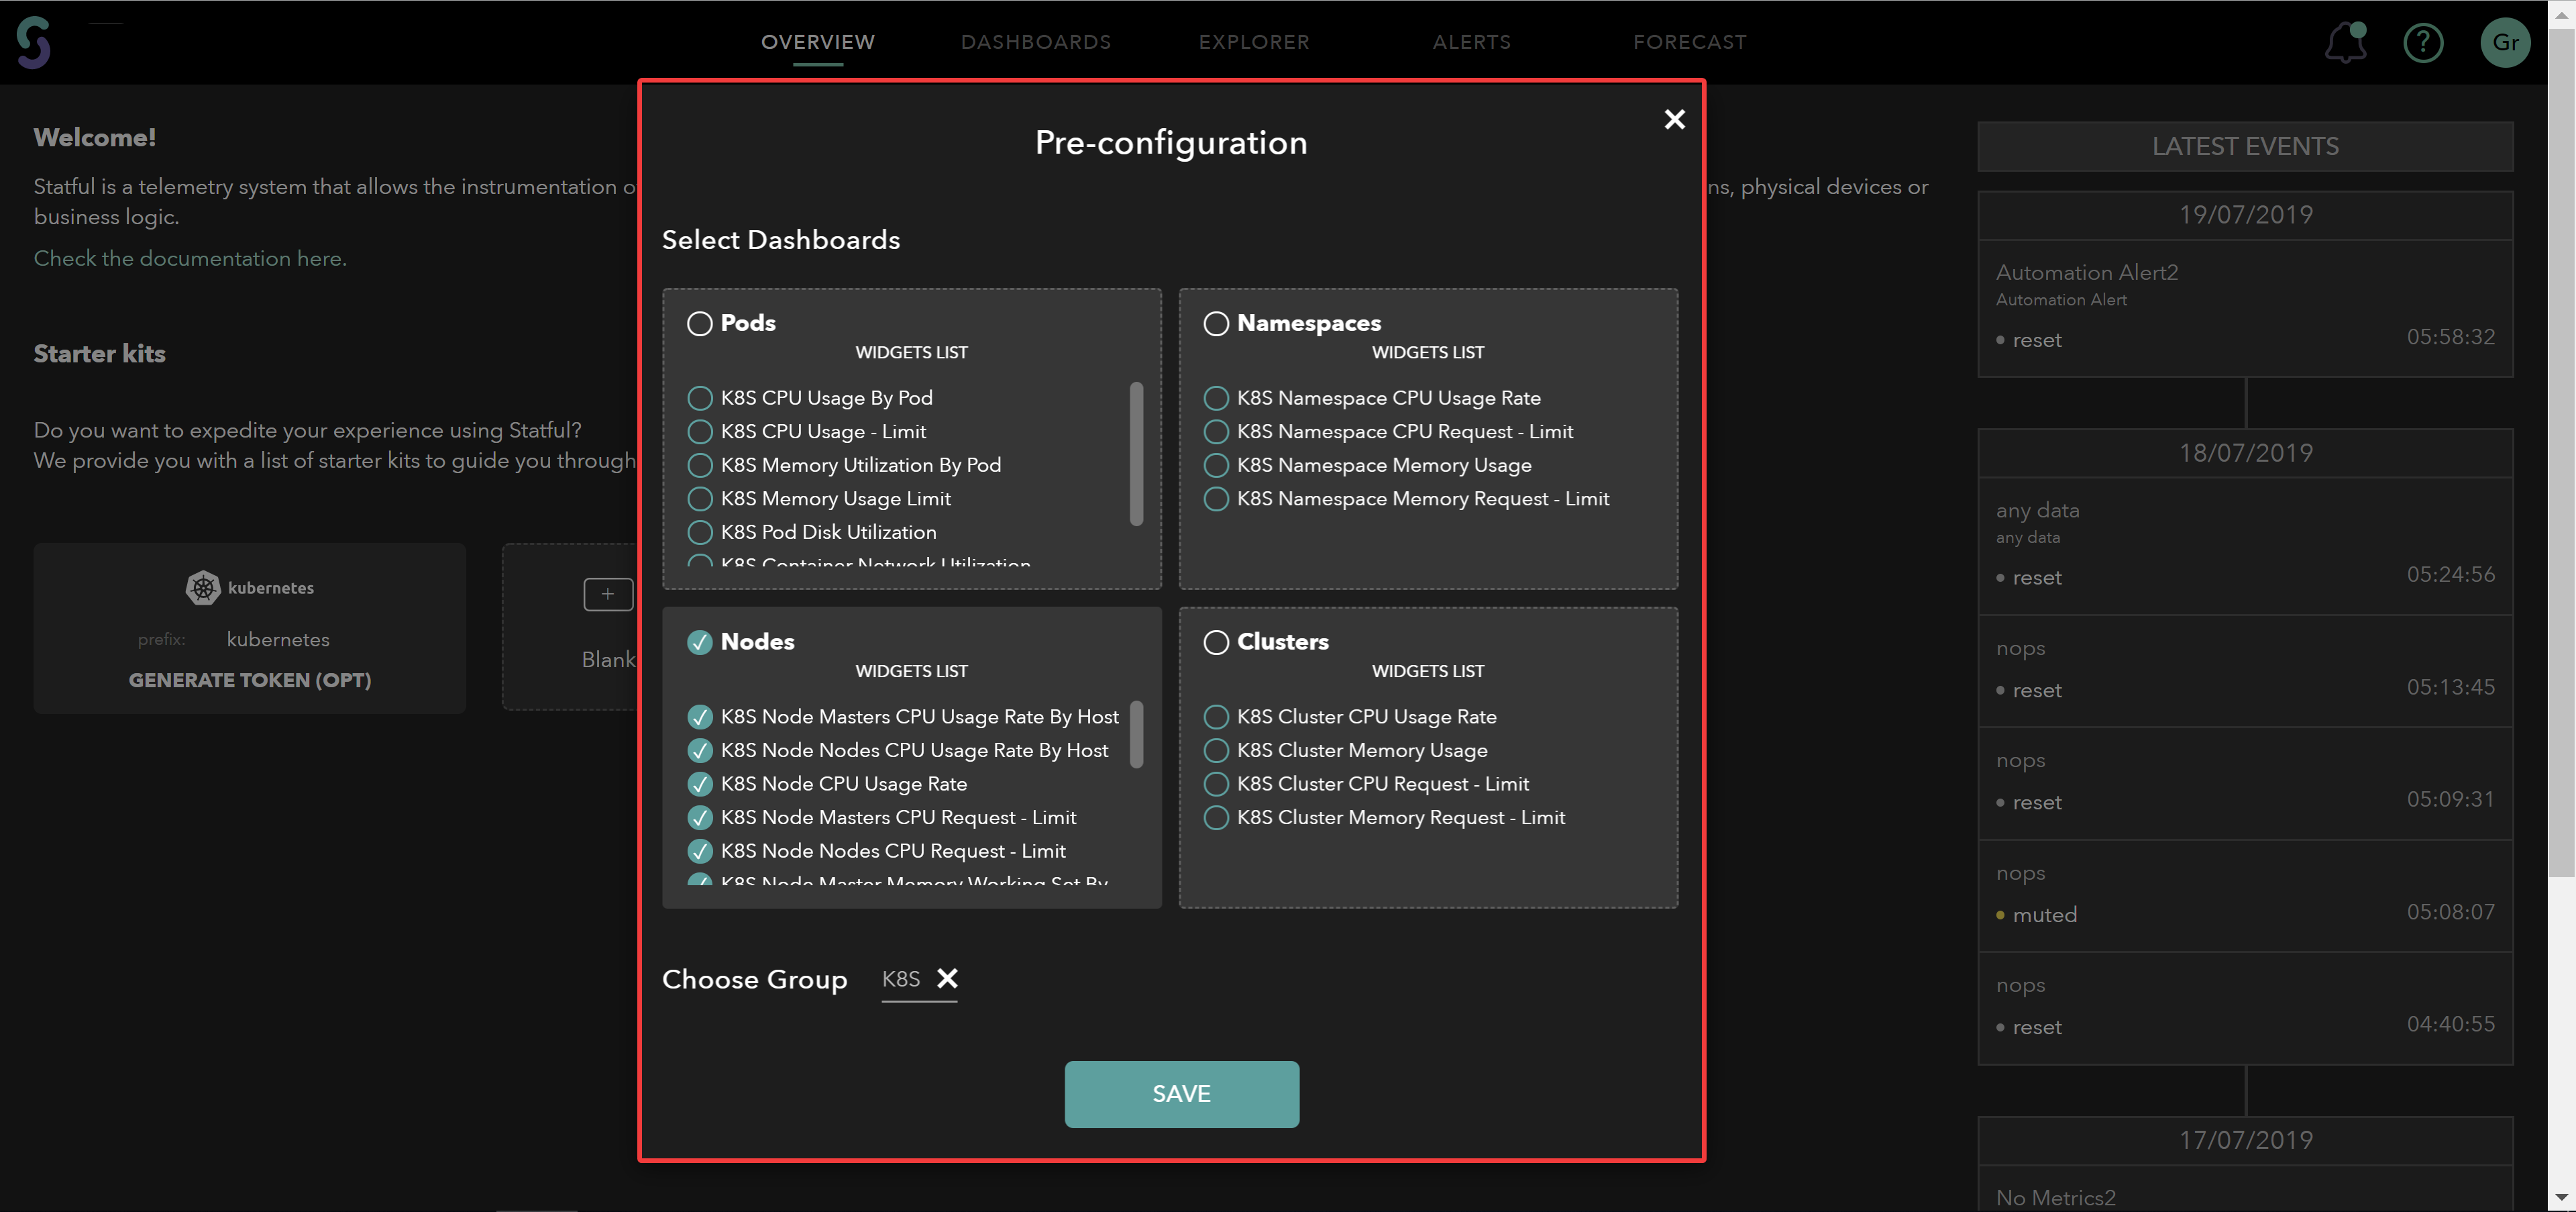
A Widgets list is presented for each Dashboard. We organised them over themes, according to what the service offers, and based on our customers’ experience. This way, some Starter Kits may include more Widgets than others.
Once you’re happy with your selection, assign it to a Dashboard group (works like an index for your Dashboards), by selecting an existing group from the dropdown, or type in a name to create a new one.
Then, SAVE your choices, or go back and choose a different Starter Kit.
When you are DONE, you can head out to the Dashboards menu, where your environment should be up and running, like the one below.
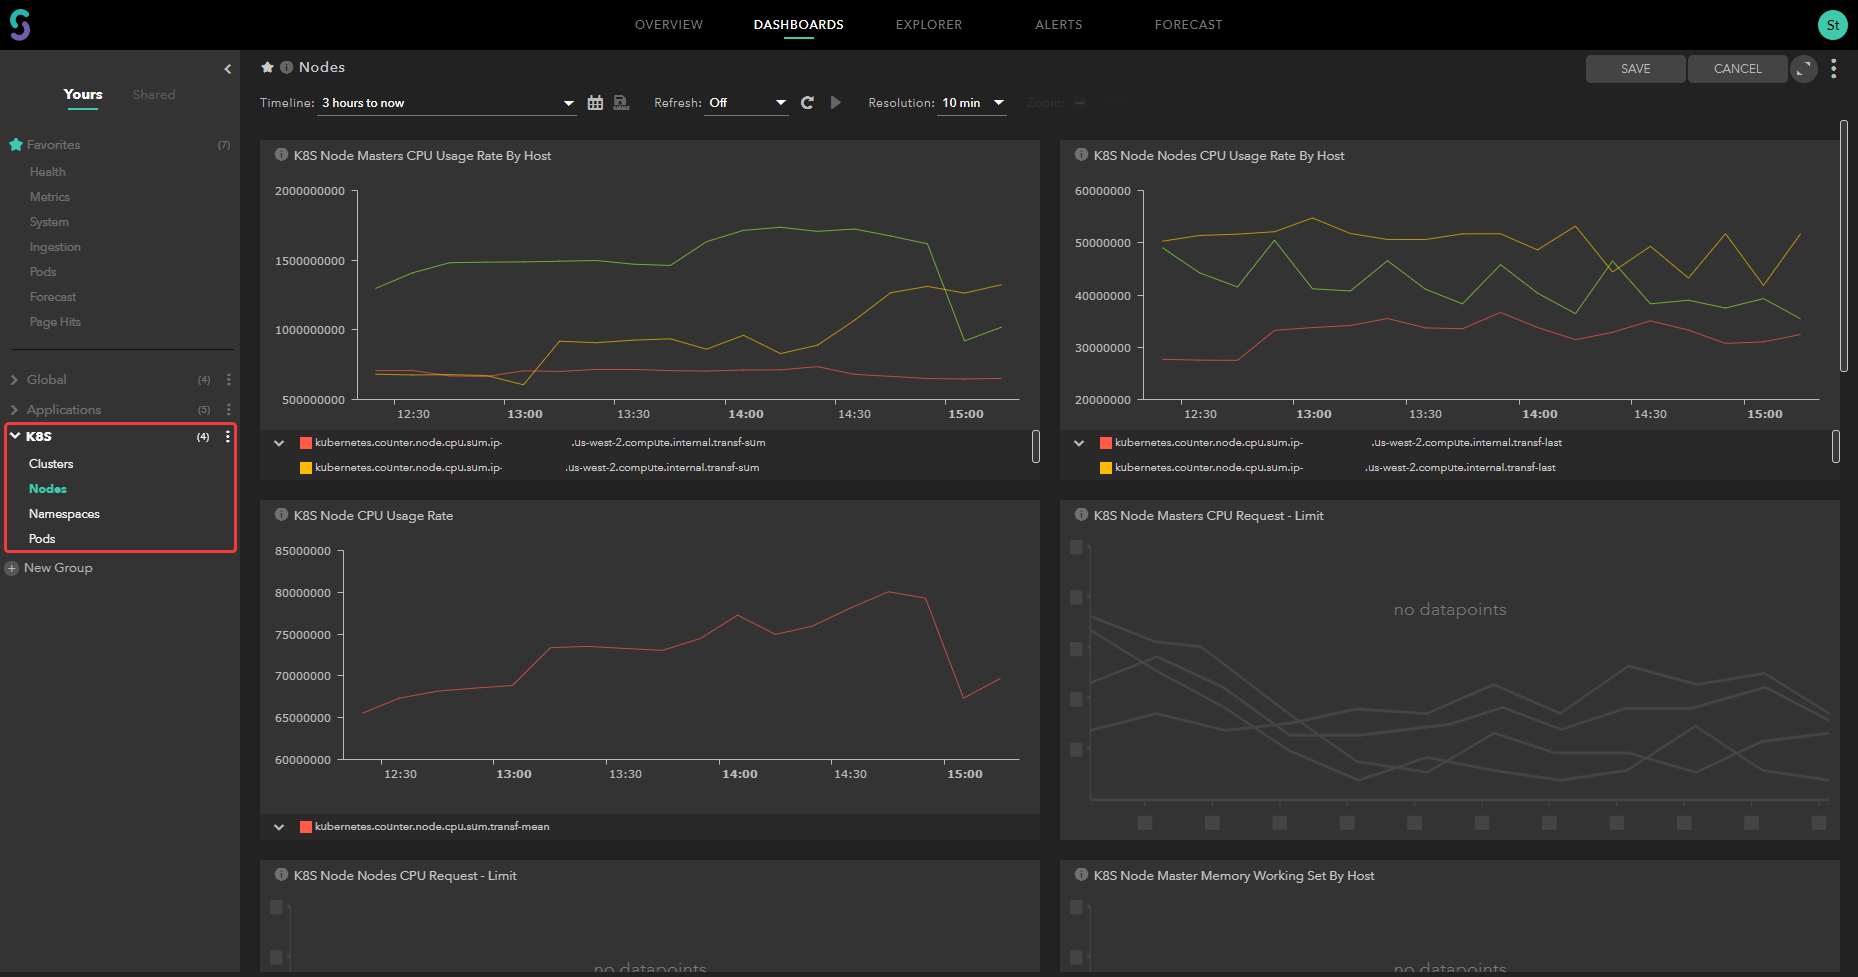
If you face any issue, feel free to contact our Statful team by sending an email to our support.
Widgets List
Below you can find the title of all the service-specific Dashboards we offer for each configuration.
AWS collector
This collector retrieves metric data from AWS Cloudwatch to send to Statful. For more information, please visit Amazon Cloudwatch Documentation, or check our configurations.
EC2
EC2 Status Check Failed Count
EC2 CPU Utilization %
EC2 Average Credit Usage By ASG
EC2 Average Credit Balance By ASG below 100
EC2 Average CPU Utilization By ASG over 50 Perc
RDS
RDS Average CPU Utilization
RDS Average Database Connections
RDS Average Credit Usage
RDS Average Credit Balance
RDS Average Queries
RDS Average Throughput
ELB
ELB Error Response Count
ELB Backend Response Count
ELB Request Count with 1d Baseline
ELB Health Host Status
ELB Average Surge Queue Length
ELB Average Latency
ELB Latest Latency Seconds
Billing
AWS Spending by Service
Kubernetes collector
This collector retrieves data of cluster-wide prometheus metrics to send to Statful. For more information go to the official site, or check our configurations.
Pods
K8S CPU Usage By Pod
K8S CPU Usage - Limit
K8S Memory Utilization By Pod
K8S Memory Usage Limit
K8S Pod Disk Utilization
K8S Container Network Utilization
K8S Pod Number
Namespaces
K8S Namespace CPU Usage Rate
K8S Namespace CPU Request - Limit
K8S Namespace Memory Usage
K8S Namespace Memory Request - Limit
Nodes
K8S Node Masters CPU Usage Rate By Host
K8S Node Nodes CPU Usage Rate By Host
K8S Node CPU Usage Rate
K8S Node Masters CPU Request - Limit
K8S Node Nodes CPU Request - Limit
K8S Node Master Memory Working Set By Host
K8S Node Nodes Memory Working Set By Host
K8S Node Memory Usage - Working Set
K8S Node Masters Memory Request - Limit
K8S Node Nodes Memory Request - Limit
K8S Node Masters Network Usage
K8S Node Masters Network Error Rate Cumulative
K8S Node Nodes Network Usage Cumulative
K8S Node Nodes Network Error Rate Cumulative
K8S Node Uptime By Host
Clusters
K8S Cluster CPU Usage Rate
K8S Cluster CPU Request - Limit
K8S Cluster Memory Usage
K8S Cluster Memory Request - Limit
NodeJS client
This client, written in Javascript, gathers metric data to send to Statful. You can check our configurations here.
Health
Blocked Event Loop
Flush queue length
OS Uptime
App Uptime
System
App used memory vs. OS total memory
App used memory (%)
App free memory
Vert.x client
This collector retrieves metrics data to send to Statful. For more information go to the official site, or check our configurations.
Client
Client Execution Times by HTTP Verb
Client Request Count by HTTP Verb
Client Request Count by Request Type
Client Execution Times by Request Type
Server
Service Calls Execution Times P95
Server Execution Times by HTTP Verb
Server Request Count by HTTP Verb
Server Request Count by Request Type
Server Execution Times by Request Type
Pool
Connection Pool Max Size by Name
Connection Pools by Name and Type